| Clone ID | DM50 |
|---|---|
| Target | |
| Immunogen | PME100017 |
| Synonyms | CTLA4; CD152 |
| Host Species | Rabbit |
| Description | Anti-CTLA-4 antibody(DM50); Rabbit mAb |
| Delivery | In Stock |
| Uniprot ID | P16410 |
| IgG type | Rabbit IgG |
| Clonality | Monoclonal |
| Reactivity | Human |
| Applications | ELISA; Flow Cyt |
| Recommended Dilutions | ELISA 1:5000-10000; Flow Cyt 1:100 |
| Purification | Purified from cell culture supernatant by affinity chromatography |
| Endotoxin | Less than 1.0 EU/μg by the LAL method. For <1 EU/mg requirements, please contact us for customization. |
| Formulation & Reconstitution | Lyophilized from sterile PBS, pH 7.4. Normally 5 % – 8% trehalose is added as protectants before lyophilization. Please see Certificate of Analysis for specific instructions of reconstitution. |
| Storage&Shipping | Store at -20°C to -80°C for 12 months in lyophilized form. After reconstitution, if not intended for use within a month, aliquot and store at -80°C (Avoid repeated freezing and thawing). Lyophilized proteins are shipped at ambient temperature. |
| Sterility | Products are supplied non-sterile. For cell culture applications, dilute in appropriate medium and sterile-filter (0.22 µm) prior to use. |
| Background | This gene is a member of the immunoglobulin superfamily and encodes a protein which transmits an inhibitory signal to T cells. The protein contains a V domain; a transmembrane domain; and a cytoplasmic tail. Alternate transcriptional splice variants; encoding different isoforms; have been characterized. The membrane-bound isoform functions as a homodimer interconnected by a disulfide bond; while the soluble isoform functions as a monomer. Mutations in this gene have been associated with insulin-dependent diabetes mellitus; Graves disease; Hashimoto thyroiditis; celiac disease; systemic lupus erythematosus; thyroid-associated orbitopathy; and other autoimmune diseases. |
| Usage | Research use only |
| Conjugate | Unconjugated |
| DIMA Disclaimer | All DIMA recombinant antibodies are genuinely generated by DIMA Biotech. They are all under patent application. Any protein sequencing or reverse engineering attempt is prohibited. We are actively scr |
Anti-CTLA-4 antibody(DM50); Rabbit mAb
Price: 10μg $99.00 ; 100 μg $446.00 ; 500 μg $1340.00
Product Data Dima FAQ
Images Dima FAQ
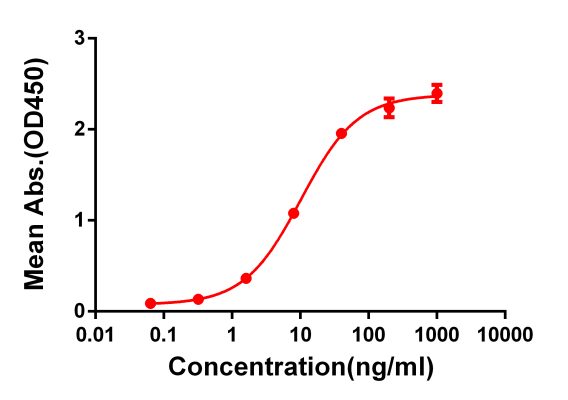
Figure 1. ELISA plate pre-coated by 2 μg/ml (100 μl/well) Human CTLA4 protein, mFc-His tagged protein (PME100017) can bind Rabbit anti-CTLA4 monoclonal antibody (clone: DM50) in a linear range of 1-100 ng/ml.
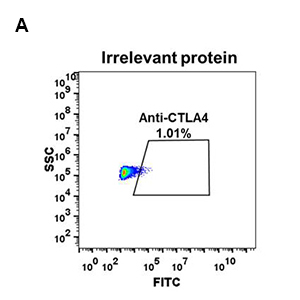
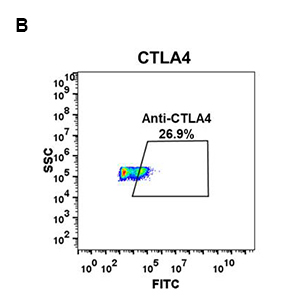
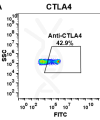
Figure 2. HEK293 cell line transfected with irrelevant protein (A) and human CTLA4 (B) were surface stained with Rabbit anti-CTLA4 monoclonal antibody 1μg/ml (clone: DM50) followed by Alexa 488-conjugated anti-rabbit IgG secondary antibody.
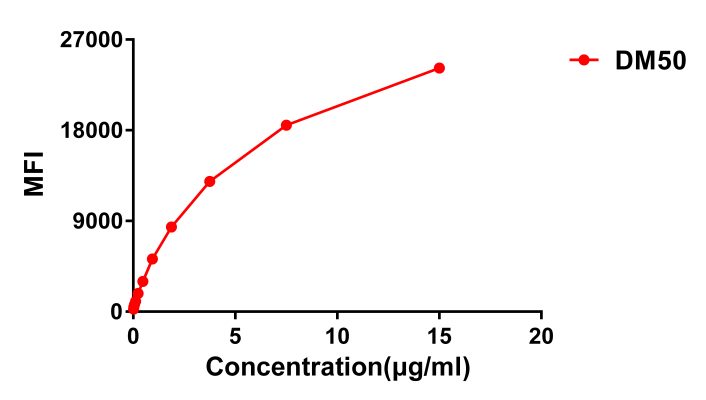
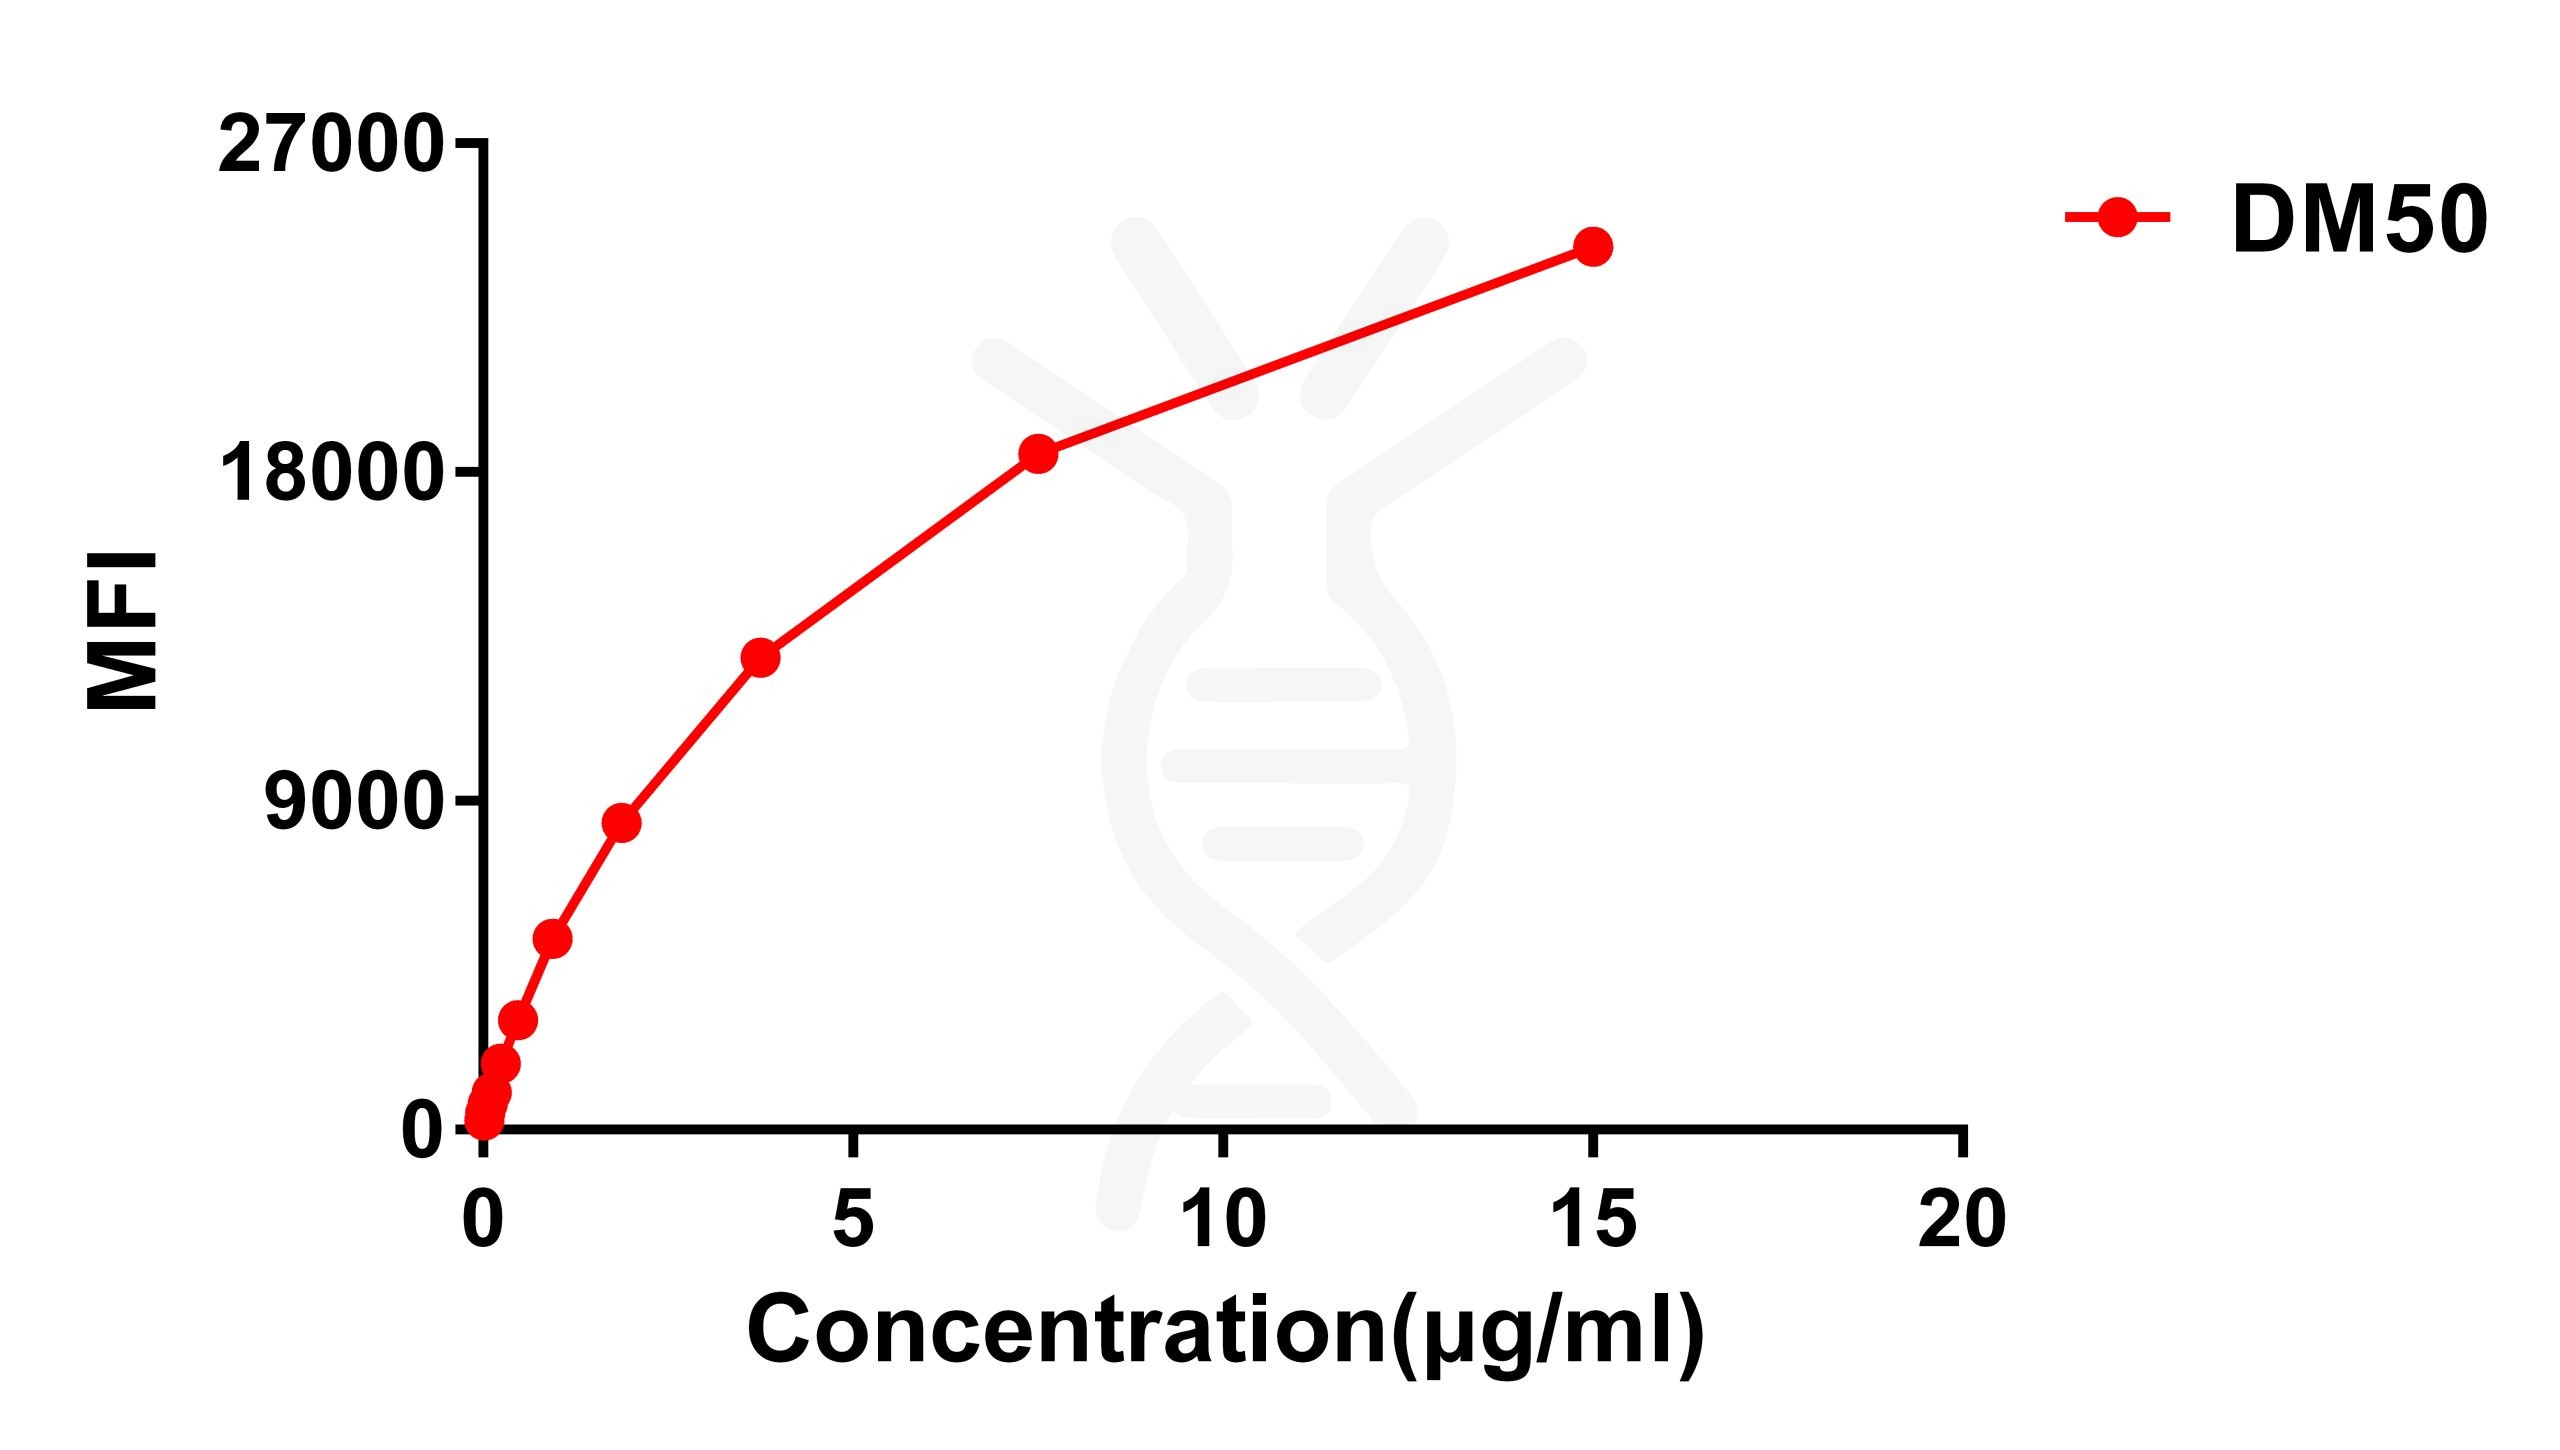
Figure 3. Flow cytometry data of serially titrated Rabbit anti-CTLA4 monoclonal antibody (clone: DM50) on Raji cells. The Y-axis represents the mean fluorescence intensity (MFI) while the X-axis represents the concentration of IgG used.
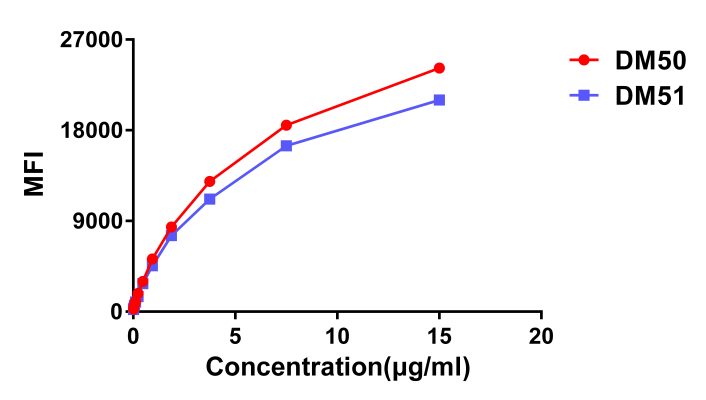
Figure 4. Affinity ranking of different Rabbit anti-CTLA4 mAb clones by titration of different concentration onto Raji cells. The Y-axis represents the mean fluorescence intensity (MFI) while the X-axis represents the concentration of IgG used.
Related Products

Biosimilar reference antibodies
SKU: BME100707 Target: CTLA-4
Application: N/A
Price: 50μg $82.00 ; 100 μg $162.00
Biosimilar reference antibodies
SKU: BME100022 Target: CTLA-4
Application: ELISA; Flow Cyt
Price: 50μg $82.00 ; 100 μg $162.00
ECD Proteins
SKU: PME100479 Target: CTLA-4 Tag: C-Human Fc Tag
Expression Host: HEK293
Price: 10μg $96.00; 50μg $370.00 ; 100 μg $555.00
Biosimilar reference antibodies
SKU: BME100577 Target: CTLA-4
Application: N/A
Price: 50μg $82.00 ; 100 μg $162.00
Biosimilar reference antibodies
SKU: BME100577B Target: CTLA-4
Application: N/A
Price: 100μg $199.00